Changes to Urine during COVID-19
Changes to Urine during COVID-19
Raman spectroscopy points to important patterns

A new study finds that people with covid have an altered chemical profile of their urine. While this discovery probably won’t replace current testing to see if someone is positive for the virus, it has big potential uses for improving the diagnosis of Long Covid, and for tracking the underlying chemical changes related to the chronic disease.
“Alterations in the molecular composition of COVID-19 patient urine, detected using Raman spectroscopic/computational analysis.” PLoS One, 18 Jul 2022, PMID 35849572, Full Article.
Raman spectrography is an interesting method of chemical analysis. It involves bouncing energy (usually a laser beam) off of a chemical sample and measuring the vibrations - different molecules vibrate in different ways when zapped. With enough data processing, it is possible to figure out what is present in a sample. The technology has advanced rapidly in recent years; small, powerful, relatively inexpensive Raman devices are starting to appear for conducting specialized chemical analysis.
Although Raman spectroscopy can be used to look for particular molecules, the method used in this study did not do that. This study involved taking complex ‘fingerprints’ of the urine, and comparing the fingerprints of those known to have covid against those who do not suffer from the condition. And it was relatively easy to come up with a formula or algorithm that accurately looks at a raman urine fingerprint, and then tells us with a high degree of accuracy whether it is from a person with covid or from a healthy person.
Although the curves above look rather similar to the human eye at first glance, there are important differences that are apparent to a trained eye - and even more so to a computer.
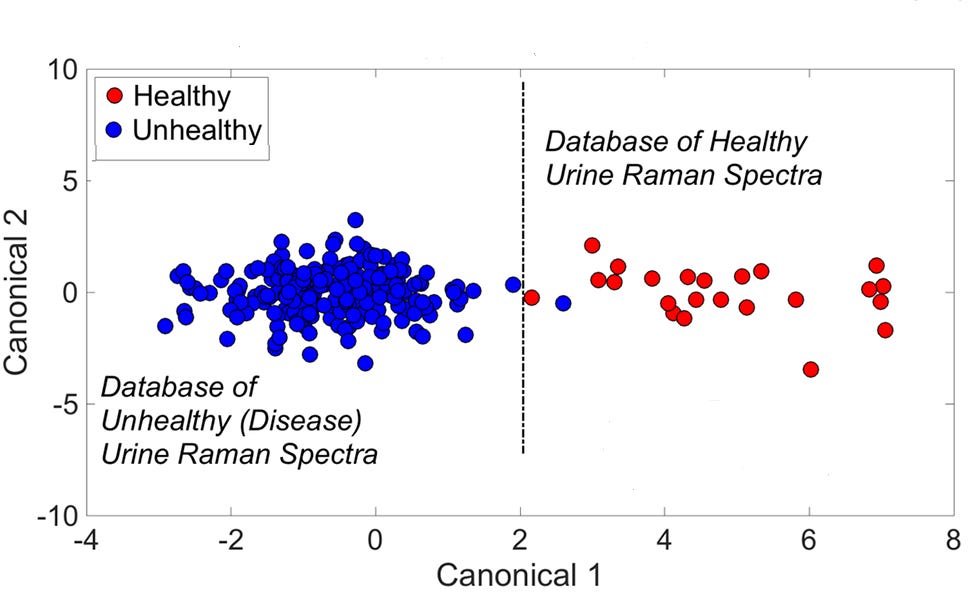
When subject to a method called principal components analysis (see below), the urine samples map out in distinct groupings. There is a bit of overlap between the healthy and unhealthy signatures, but very little. In this data set, there are two patients with covid that are near the dividing line (and one is over, and would be misclassified). And there is one healthy person’s urine that is next to the dividing line. Not surprising. It’s possible that the two infected blue dots that are closest to the ‘healthy’ region had milder infections, or they were somehow churning out fewer of the metabolic products that signal a covid infection. And one ‘healthy’ person was right on the line - but maybe they had some other simmering virus or a minor kidney issue that put unusual metabolic compounds into their urine.
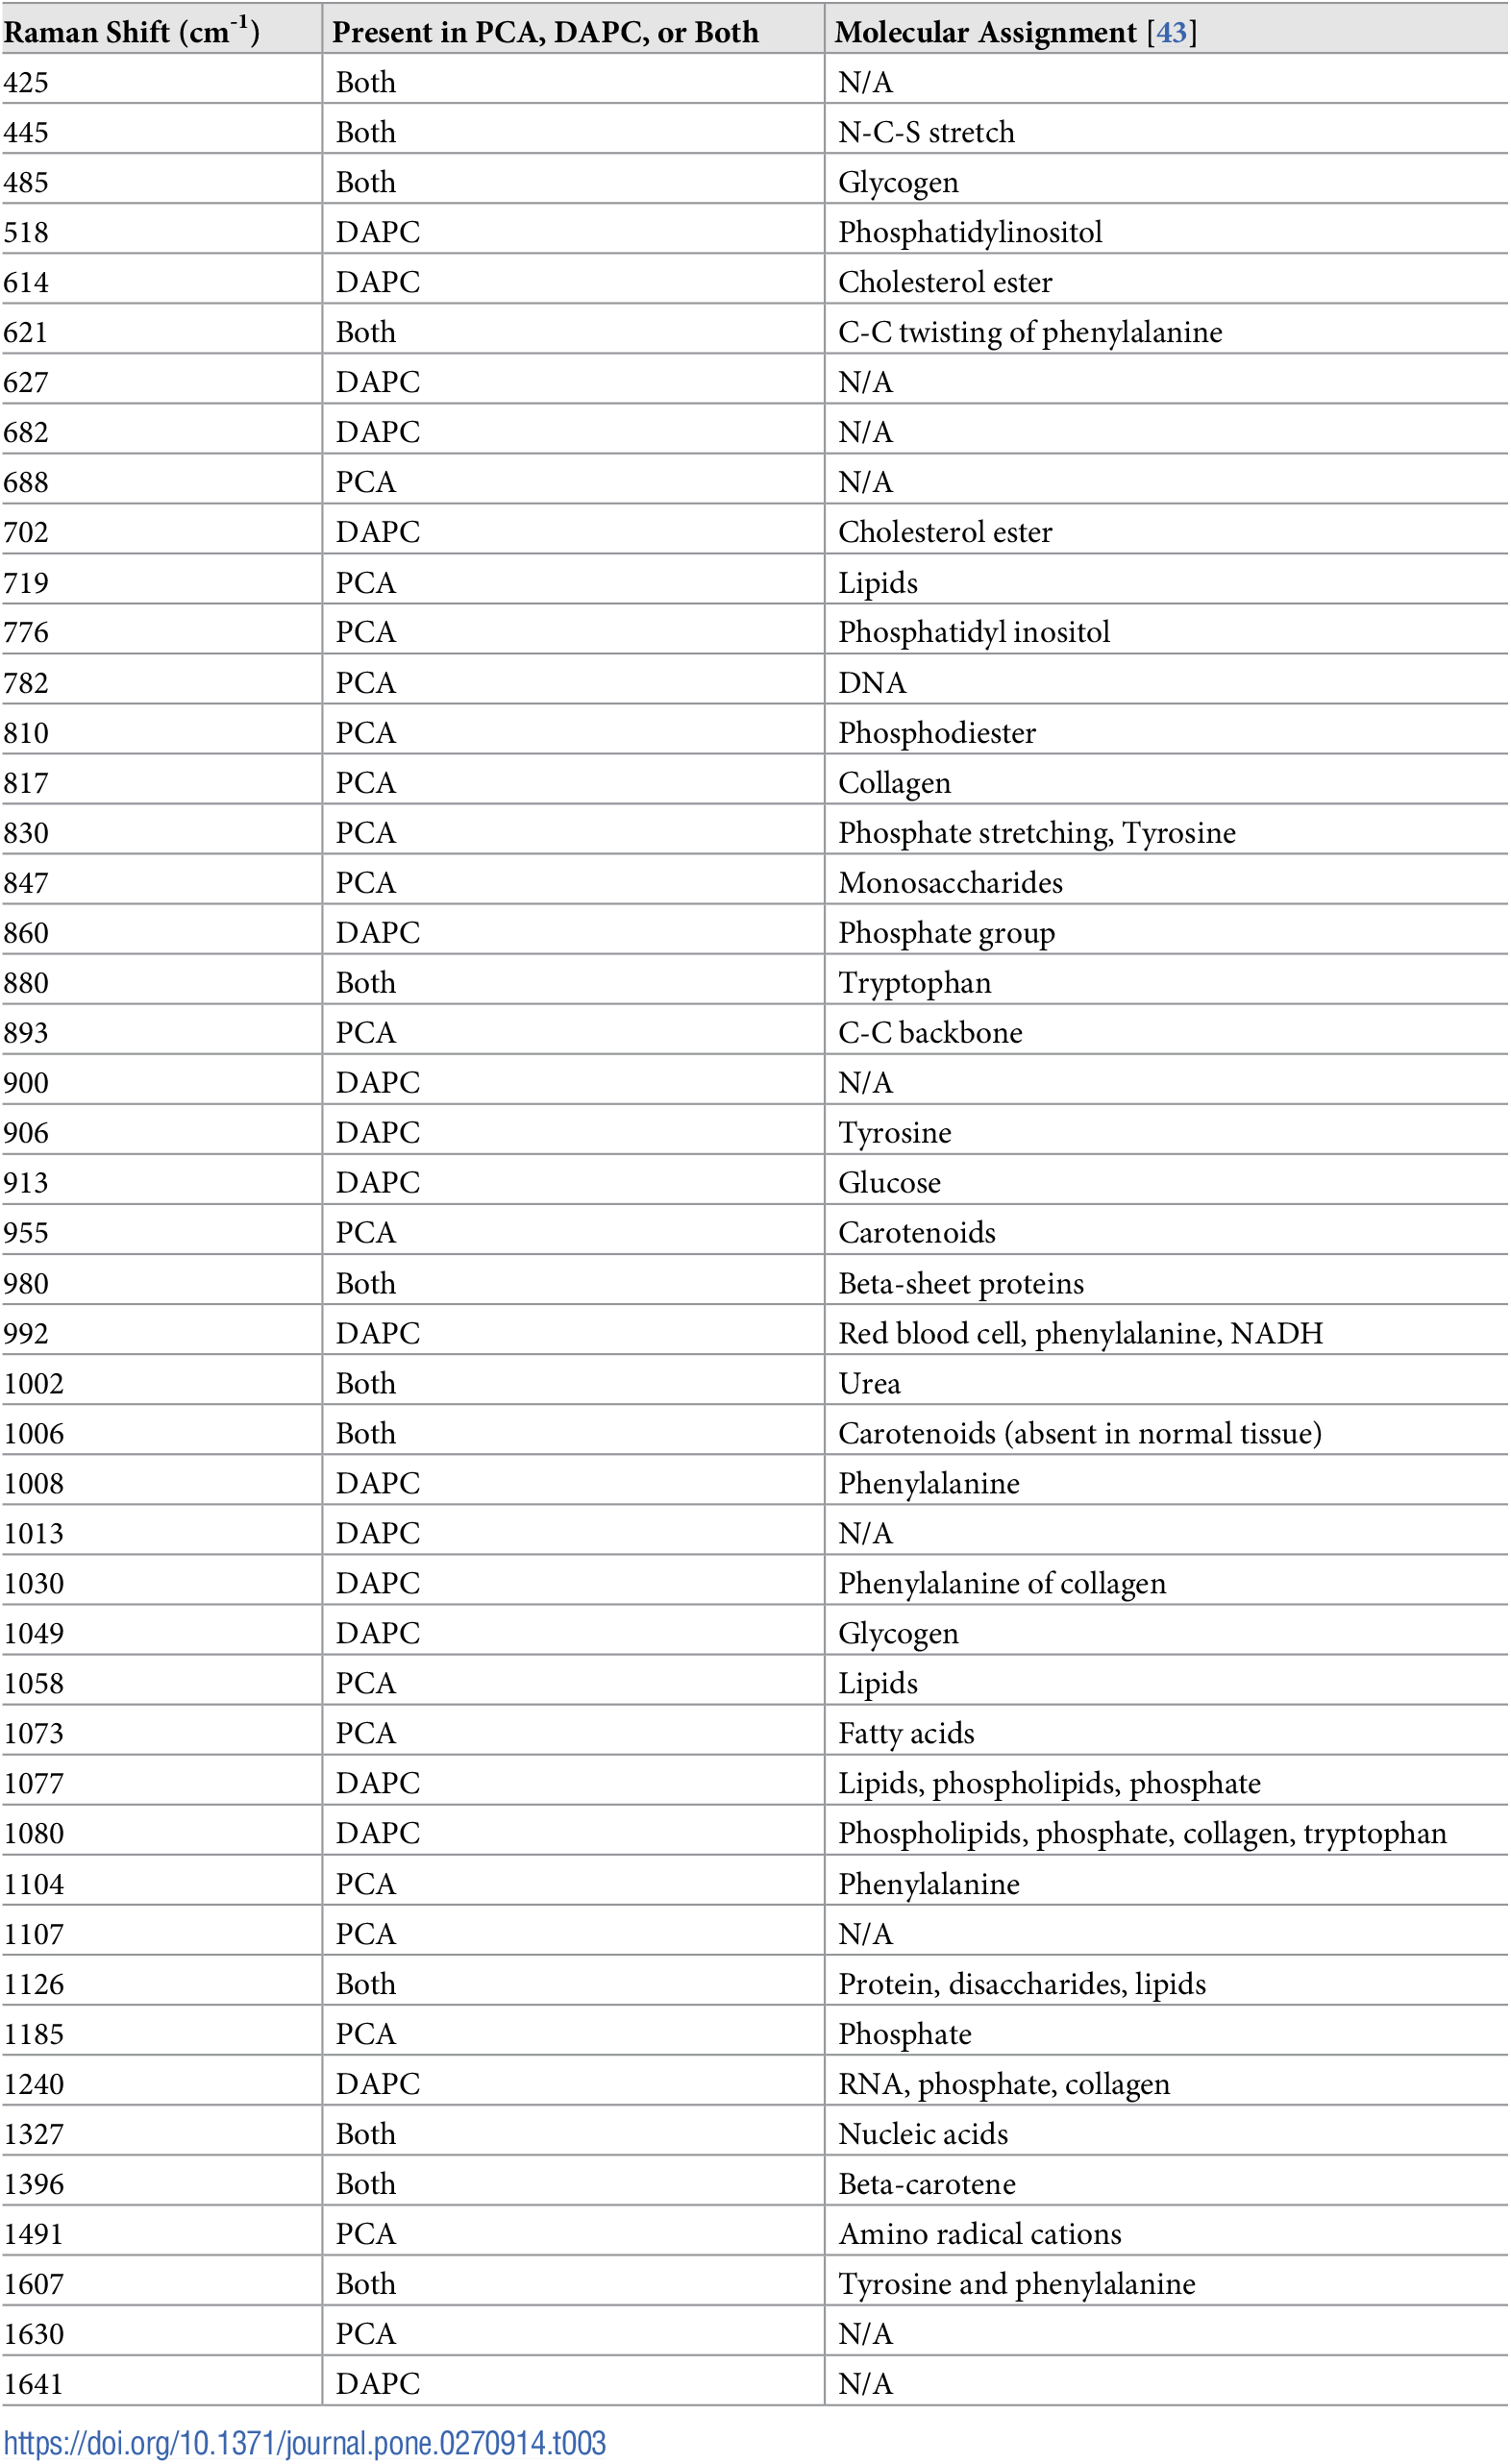
Although this study did not rely on detecting individual molecules to make the distinction between covid and non-covid, they did go in after the fact and looked at some of the chemical differences between the 2 groups. Here is a list that identifies some of the differences (click to enlarge). This information provides a starting point for understanding some important metabolic changes that happen with an acute infection of Covid-19.
The Bottom Line
While we don’t know yet if this method works for long covid, there is a good chance that it might. There are immunological and chemical differences between long haulers and healthy people. And Raman spectroscopy has real potential to identify those differences. I think we will see more research using this technology for Long Covid, and I think it will help diagnose, it will help track recovery; it provides a new window into what is happening in the body.